Daiquiri
You get paged for auth-service. It is 3am. The alert tells you a symptom, and the symptom is almost never the cause.
In one of the captures I built this against, three teams get paged for three services in three different namespaces. The actual fault is one node that filled its disk. Nobody who got paged owns that node, and nobody who got paged did anything wrong.
I wrote a tool that reads a capture of cluster events and answers the question the alert cannot: what caused this, and how do I know.
What I optimized for
My end user is not the person reading the output. It is the team. The person holding the pager, and the four people they would otherwise have to wake up.
That framing settled most of the design. Five things follow from it.
Know what broke, in one screen. The verdict is the first thing on the page and you can stop reading there.
Follow the trail from your symptom to its origin, through namespaces you do not own.
Stop paging on background noise. The healthy capture has real Warning events in it. Cry wolf on those and nobody trusts the tool by the sixth capture, at which point it is worse than nothing.
Disagree with the tool. Every number is recomputable from the JSON output, every threshold that decided a verdict travels with the verdict, and every suppressed finding is disclosed.
Hand the output to someone else as evidence. Redirect it and it is plain text with no escape sequences. Paste it in a channel and the quotes are verbatim.
The second one is the whole design, so it is worth going slower.
A flat prioritised list does not help you at 3am. It shows ten findings and leaves you to work out which of them are the same problem, on a cluster you half remember. That correlation work is the hard part of the job. A summary that skips it has handed you a shorter wall of text.
This is the capture I keep coming back to. Seven findings, six workloads, three namespaces, and one cause.
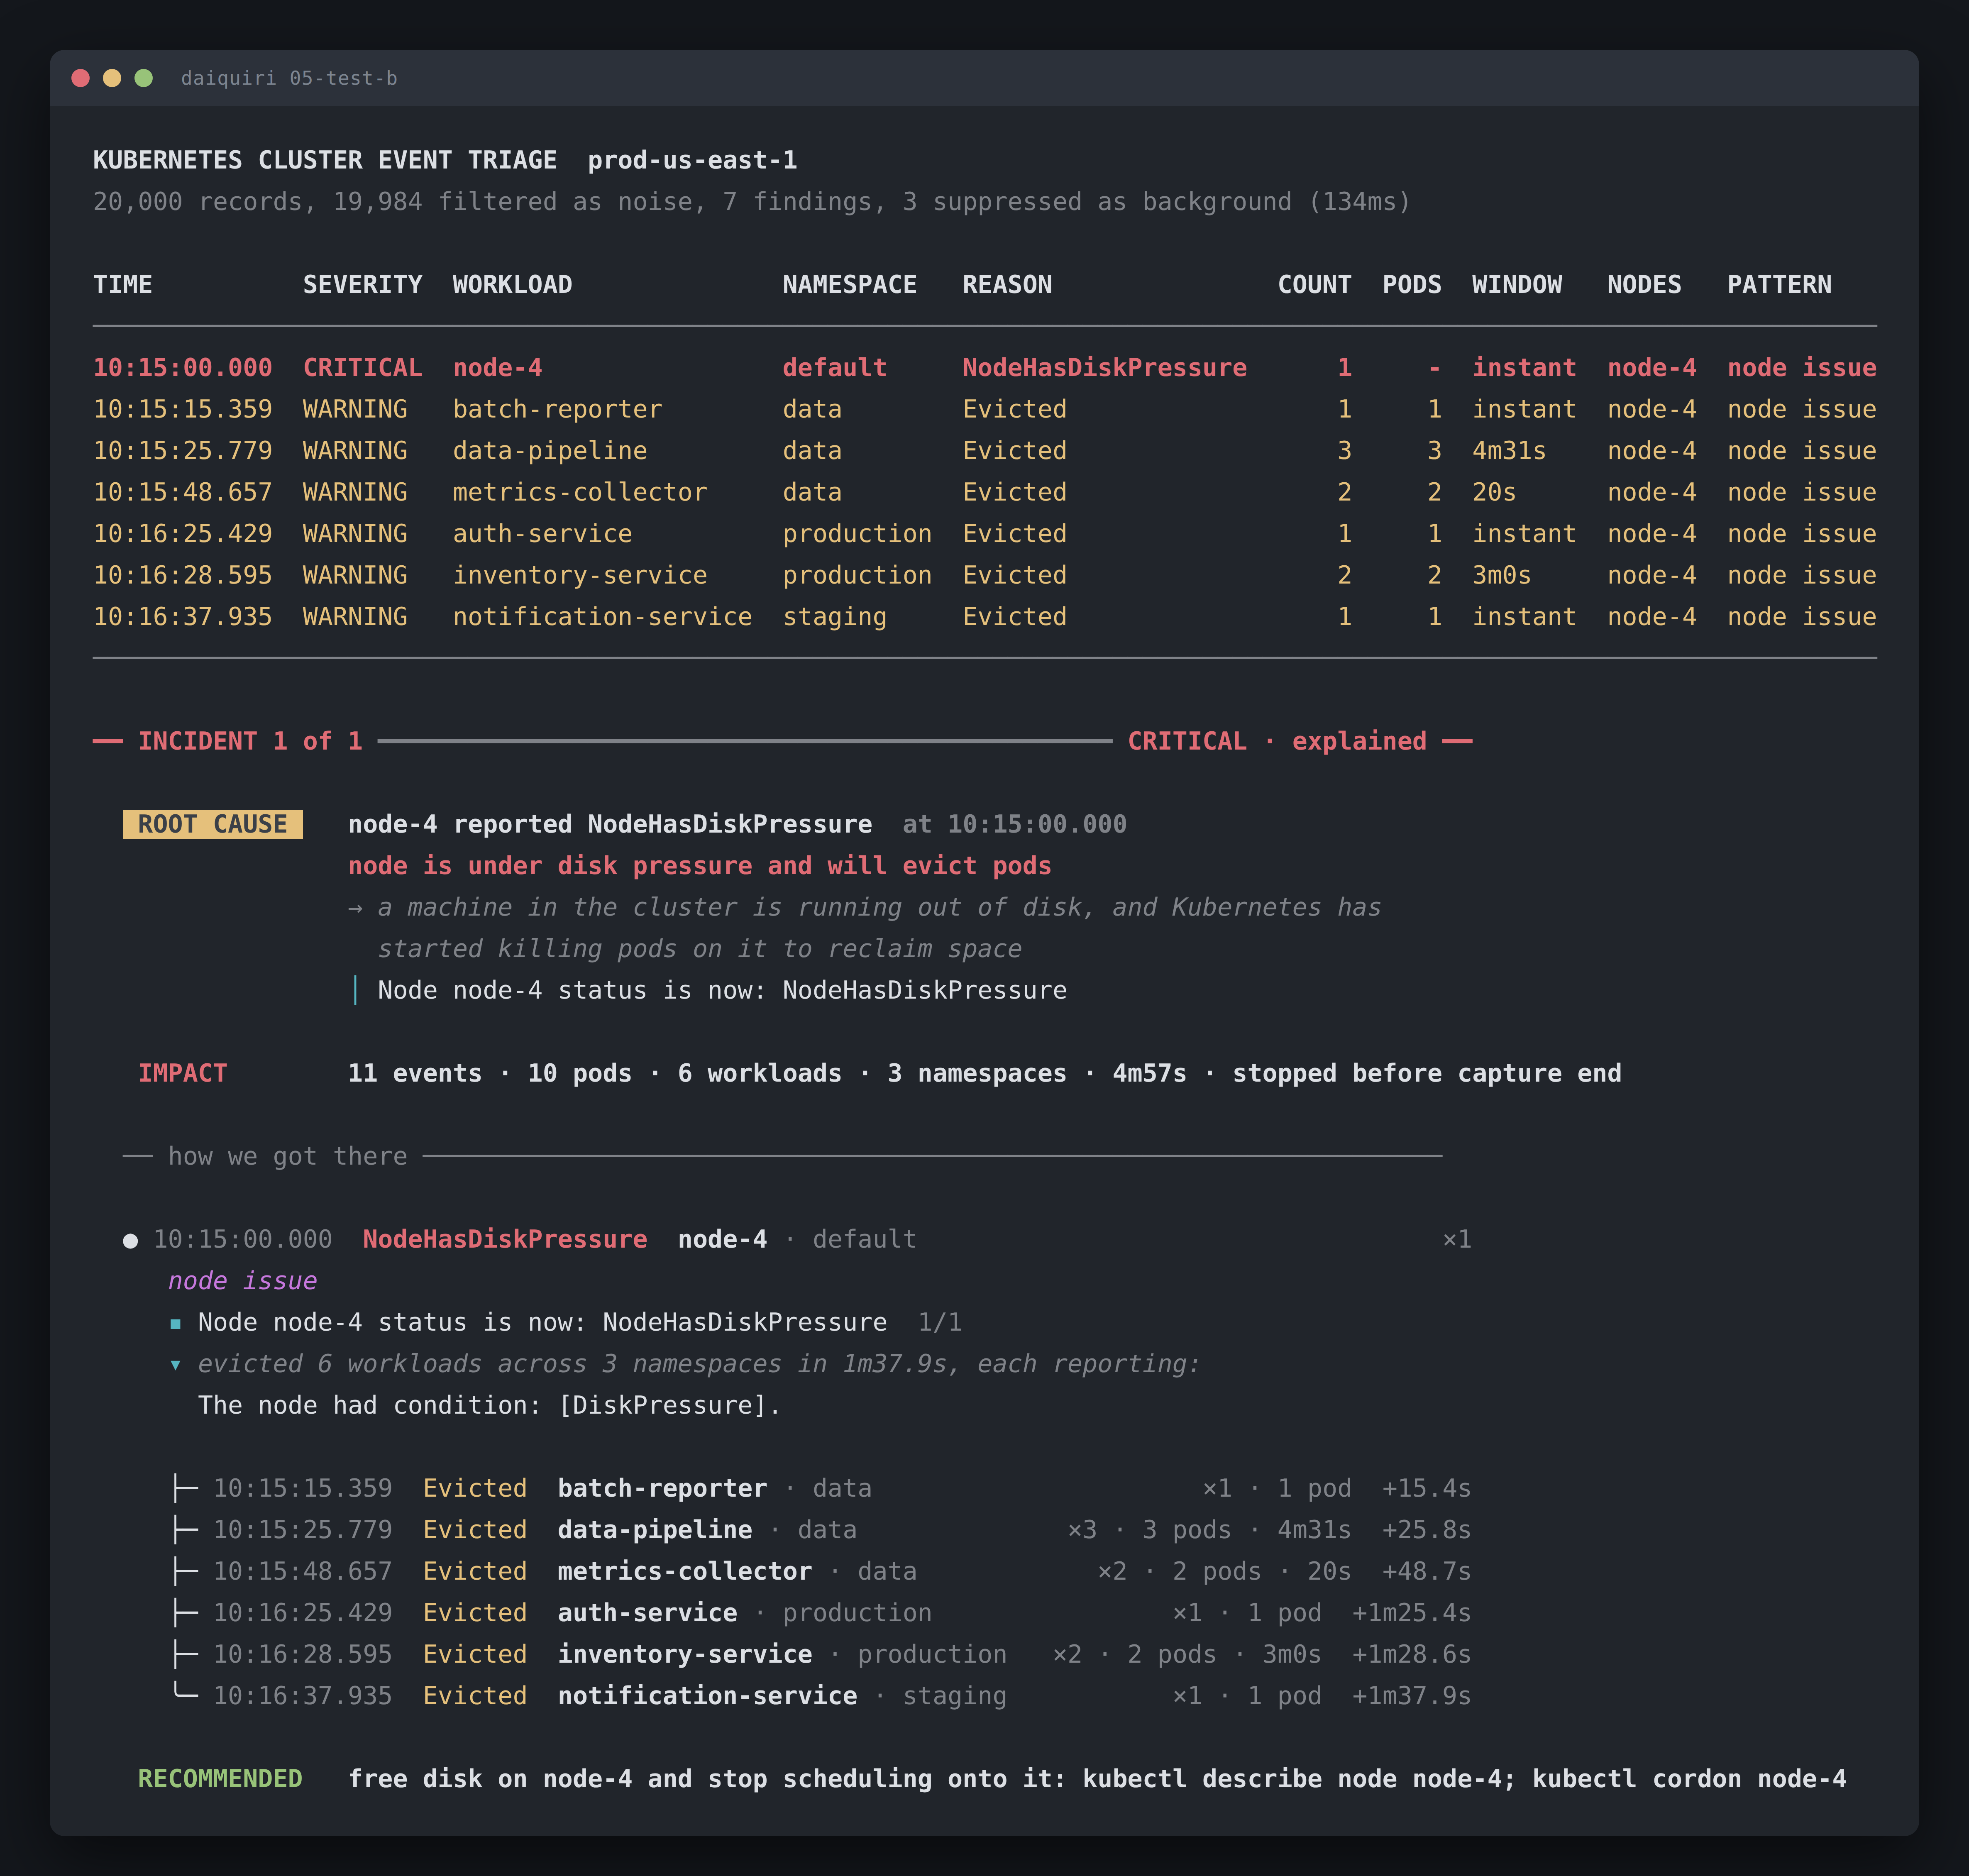
Everything below the table is the argument. The root cause, what it means in the cluster’s own words, the six workloads it evicted in order with their offsets from the cause, and one command to act on.
Grouping, and the reversal I am glad I caught
Before anything can be correlated it has to be grouped. A cluster emits 225 near-identical records for one problem, differing only in which pod instance got probed.
The group key is (Kind, Workload, Namespace, Reason, Rule).
A pod name is disposable. Key on it and one problem becomes five findings. The cluster has one problem and it is called checkout-service. So the workload name gets stripped of its ReplicaSet and pod suffixes, dispatched on kind, and when it cannot parse a name it hands the name back untouched. The worst it does is fail to roll up. A node called node-4 survives intact, which took a regression test to keep true, because a naive suffix strip mangles it.
Rule is the taxonomy row that fired, and it is in the key because one reason can carry two unrelated failure modes. One capture has Evicted for disk pressure and Evicted for memory pressure, thirteen minutes and one node apart. Without the rule in the key they merge into a single finding that is two problems.
Then there is the field I put in and took back out.
I added Node to the key on the strength of one capture. A pipeline service is evicted on node-2, then again on node-4 thirteen minutes later. Drop the node from the key and those merge into one finding whose first occurrence is fifteen minutes before the disk pressure that caused half of them. Effects cannot precede causes, so the causal rule correctly refuses the link, and the diagnosis dies.
Then I ran the same key over the other five captures.
| Capture | Without Node | With Node |
|---|---|---|
| 02 recommendation-service | 2 findings | 8, four pods on four nodes |
| 03 payment-service | 2 | 6 |
| 04 checkout-service | 1 | 3 |
| 05 data-pipeline | 1 impure | 2 clean |
Fixes one capture, shatters four. A memory leak belongs to the workload. Which node it lands on is an accident of scheduling.
So the node came back out, and the impure finding gets disclosed rather than split. What I took from it: group conservatively, then let linking do the joining. Merging destroys information you cannot get back.
The Forest
The causal structure is the piece of this design I would defend longest.
A forest is a set of trees. Every node has at most one parent, a node with no parent is a root, and unlike a single tree it can hold several independent incidents at once. One capture has exactly that shape: a node fault with six children, plus a background eviction that belongs to nothing.
The representation is one integer per finding, and that is the entire thing:
1type Forest struct {
2    Findings []group.Finding // ascending by FirstSeen
3    Edges    []Edge          // parallel; Edges[i] describes Findings[i]
4}
5type Edge struct { Parent int; Kind Kind; Evidence string }
Edges[i].Parent is the index of the finding that explains Findings[i], and -1 means nothing explains it. No pointers, no node objects, no adjacency list, no allocation per edge. At ten findings the whole causal structure of a 16 MB capture is ten integers.
Findings are sorted by first occurrence, and the builder only ever scans backwards from i looking for a parent. That gives one invariant:
Edges[i].Parent < i for every i, by constructionThat single line does most of the work in this design. Everything below is a consequence of it rather than code I had to write.
| Property | Why it holds for free |
|---|---|
| Cycles are impossible | a parent is always at a lower index, so a cycle would need i < i. No visited set, no cycle check, no error path, nothing to unit test |
| Findings are already topologically ordered | sorting by time is the topological sort |
| Children need no index | scan forward from i+1. No adjacency list, no map to keep in sync |
| Walking to the root is an integer loop | over a slice already in cache. 2.3 nanoseconds, zero allocations, at a thousand findings |
| Effects can never precede causes | the ordering enforces it |
I have written cycle detection into graph code before. Here there is nothing to detect, because the layout makes the bad state unrepresentable.
Why a forest and not a graph
Real causality is a directed acyclic graph. Several things genuinely contribute to one failure. I chose a forest anyway, because of what a second parent does to the output: it turns “pull the thread” into a branching interrogation with three leads and no answer.
The cost is that joint causation cannot be expressed, and I would rather write that down than let someone discover it.
Four alternatives lost, and one is worth repeating.
Union-find has the same physical form, a parent array of integers. Both of its optimizations disqualify it. Path compression deletes the intermediate hops, and the intermediate hops are the product. Union by rank picks whichever parent balances the tree, when what I need is the parent that is true. Strip both and you are left with exactly this structure.
An interval tree or sweep line answers “which intervals overlap”, which is the wrong question in both directions. Causes are instants and effects begin afterwards, so every deploy edge and the entire multi-namespace incident has zero overlap. Overlap would miss the four best diagnoses in the corpus and invent a link between a memory leak and an unrelated probe failure.
A graph library would be larger than the structure, for an n between three and ten.
What would force a real graph: multiple parents, cycles, reachability at scale, or incremental update as records stream. None apply. If joint causation ever needs expressing, that is the trigger, and it is a rewrite of that layer rather than a patch to it.
Telling background apart from a real problem
The acceptance criterion was no false positives on the healthy capture, and I spent longer here than anywhere else.
The healthy capture is not empty. It has genuine Warning events that the taxonomy correctly calls issues. Only their shape separates them from signal.
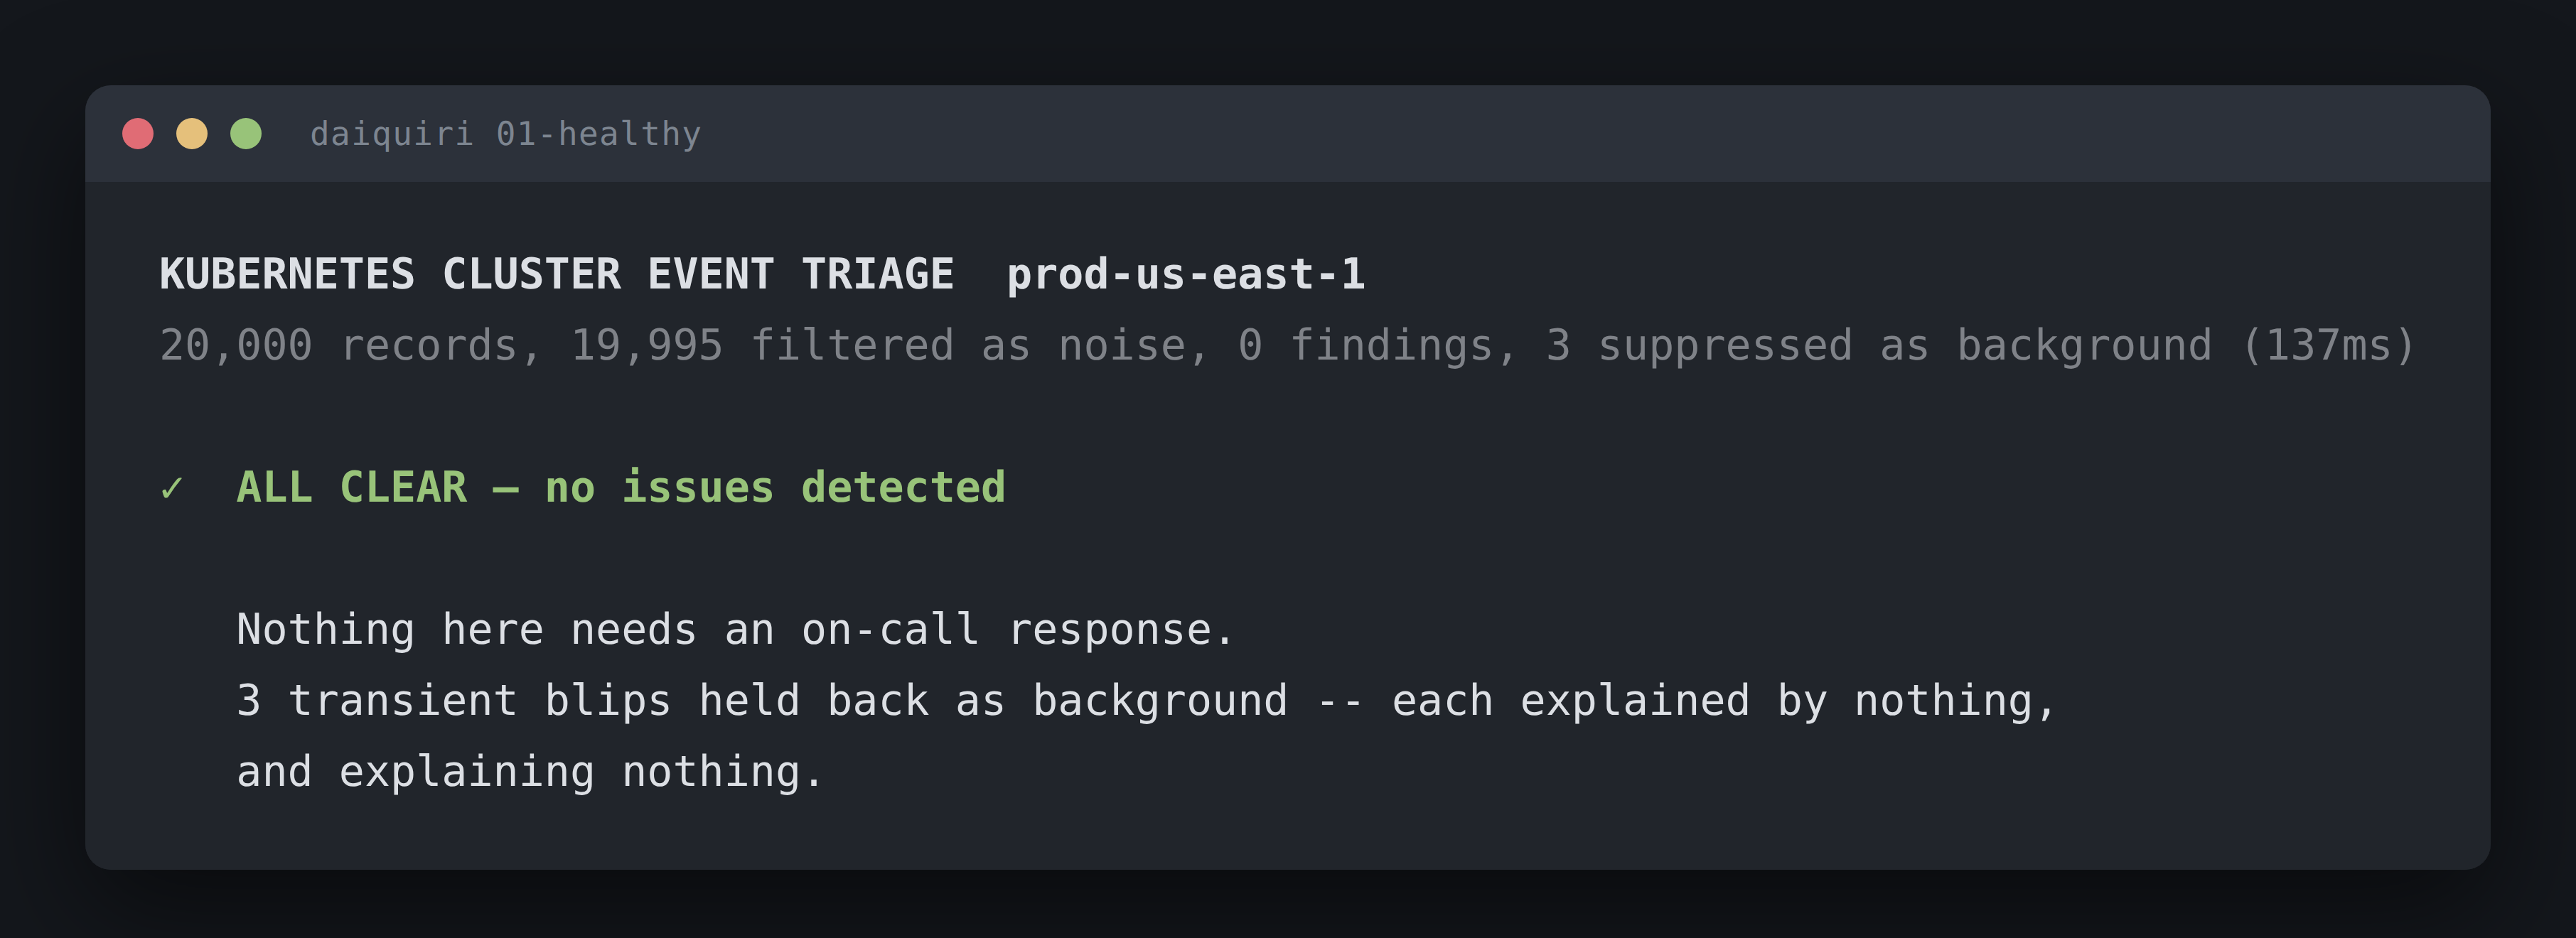
Note the header. Three findings were held back, and it says so, so “0 findings” stays checkable.
Here is what fixed it. Three findings, identical on every shape metric, three different correct verdicts:
| Capture | Finding | n | pods | span | parent | children | verdict |
|---|---|---|---|---|---|---|---|
| 01 | data-pipeline Evicted, memory | 1 | 1 | 0s | none | 0 | suppress |
| 05 | auth-service Evicted, disk | 1 | 1 | 0s | node-4 | 0 | keep |
| 05 | node-4 NodeHasDiskPressure | 1 | 0 | 0s | none | 6 | lead with it |
Count, pod count and span cannot tell those apart. Position in the forest can.
So suppression is a conjunction of four clauses: a recognized failure, small on every axis, nothing explains it, and it explains nothing. Small on every axis means at most ten occurrences, at most one pod, and a span under sixty seconds, all three holding.
The corroboration I trust most is that exactly three findings get held back in every one of the six captures, and they are always the same three shapes. A predicate tuned to one file would not land on the same three in the other five.
Two things I made sure of. A suppressed finding is counted and disclosed in the header, so “2 findings” is checkable. And an unrecognized reason never gets suppressed, because if the taxonomy does not know it, the tool has no basis to call it background.
Answering “why”
sustained crash-loop tells you the shape. It does not tell you why the thing is crashing.
That answer is already in the record bodies, buried under 222 near-identical lines that differ only in which replica got probed. So the tool normalizes the volatile parts, pod names, IPs, object UIDs, and counts what is left. 222 records collapse to 3 symptoms with counts.
Numbers with units never get normalized. 512Mi, 404, 8080 and 0/6 nodes are the answer.
Signatures rank by specificity first, frequency second. In one capture the most common line is Error: ImagePullBackOff at 18 of 24, which only restates the reason. The line naming the tag that does not exist occurs 3 times and leads anyway. Frequency alone buries the diagnosis under its own consequence.
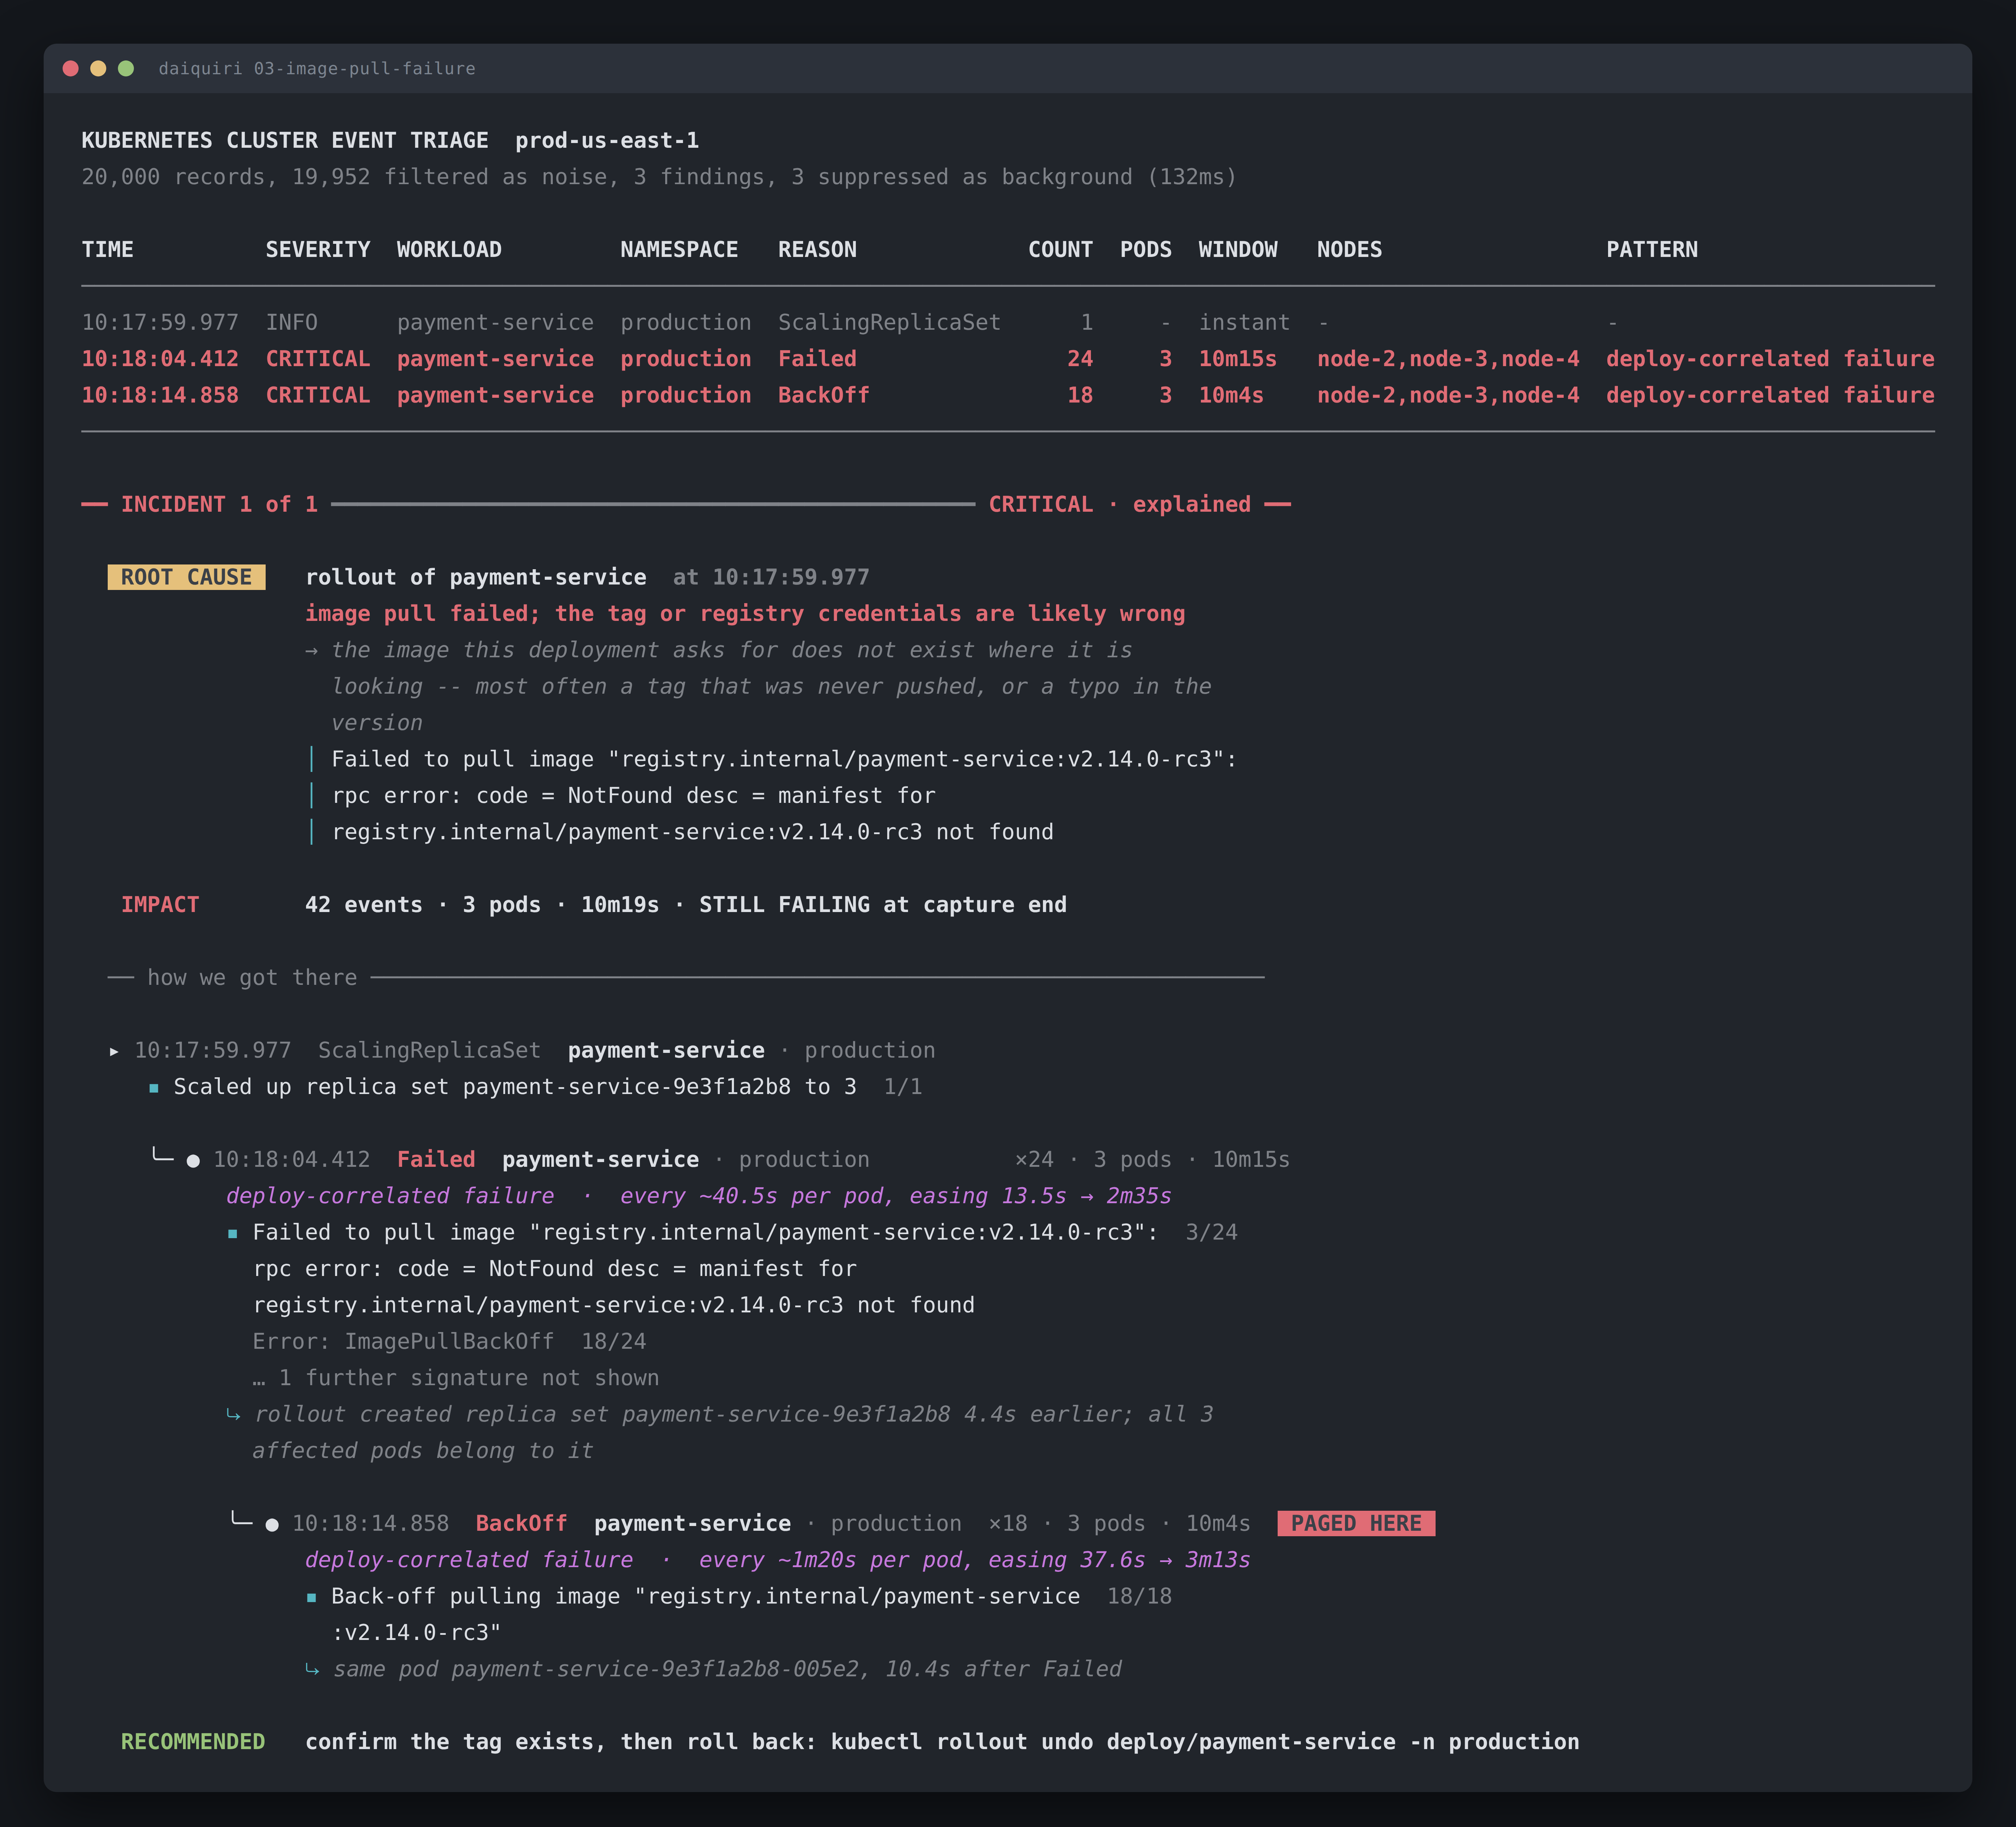
Where the body proves something the reason cannot, the signature carries a reading.
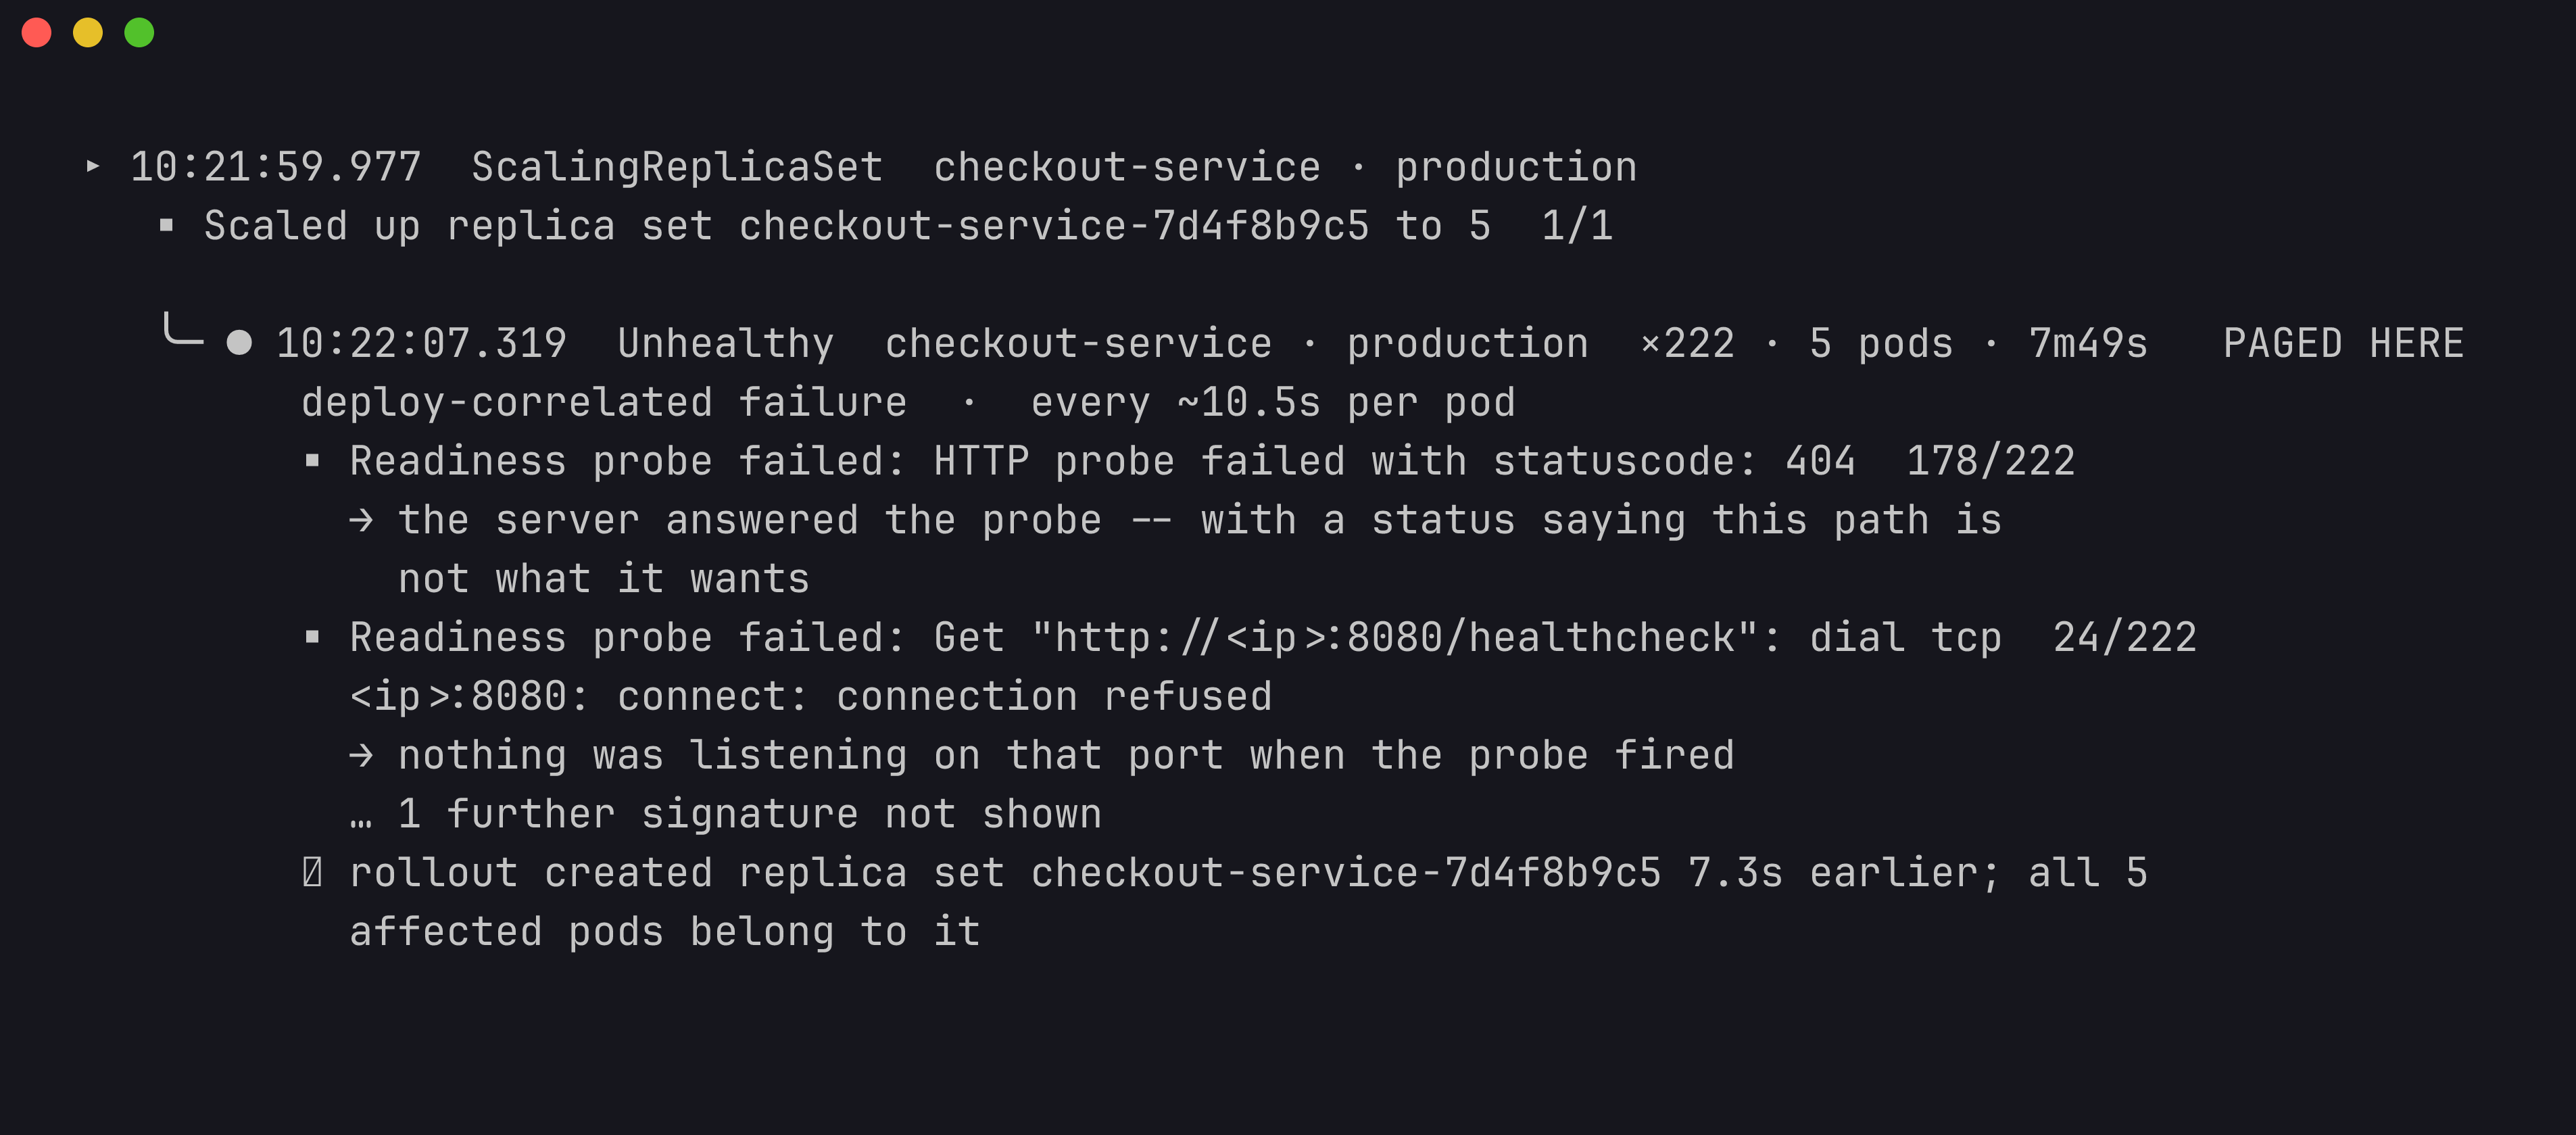
Both of those are Unhealthy at the same severity. One says the server answered and rejected the path. The other says nothing was listening on the port at all. Same reason, opposite conclusions about whether the process is even running, and a completely different next move.
The line underneath is the causal edge, quoting what it used: the rollout created that replica set seven seconds earlier, and all five affected pods belong to it. That is the tool showing its work rather than asserting a correlation.
The readings state what the evidence establishes and stop. No instructions, no “you should check”. You debug, the tool sharpens the lens. And readings exist only for shapes these captures contain, because a confident guess would be worse than silence.
Output
Two views by default. The table is the inventory, everything wrong, prioritised, one row each. The tree is the argument for what caused it. Flags narrow to one or the other and do not enable anything. Passing both is a usage error rather than a silent no-op.
Colour is emphasis only. Strip the escape sequences from the styled output and it is byte-identical to the plain output. A test asserts that on every run. It is what makes a redirected file readable.
The JSON exists so you can disagree with the tool. Every verdict sits beside the inputs that produced it: the thresholds that decided it, the records it was counted from, and each suppression clause published separately so you can see which one fired. Suppressed findings are included and flagged, because leaving them out would make the document agree with the tool by construction.
One decision I would defend hardest: a verdict is derived from its reasons and never stored beside them. Suppression is a method over the four clauses, not a field next to them. The test that forced it was “the published outcome must follow from the published clauses”, and it failed against my own fixtures back when the two were separate fields.
Why Go
I weighed it on day one and it was not close.
Kubernetes is Go. The OTel Collector is Go. Every piece of prior art I wanted to read while working out what a real BackOff body looks like in the wild is Go. If this grew past reading a file, into something that talks to the API server, Rust would mean reimplementing a mature client badly.
The problem does not want what Rust is for either. No shared mutable state, no lifetime puzzle, nothing running hot. It is a 130 millisecond batch job that allocates 15 MB and exits. Borrow checking earns you nothing on a program with one goroutine and no aliasing.
What Go actually gave me: streaming JSON with no dependency, a sort over a flat slice being the entire causal structure, testing and benchmarking in the standard toolchain with zero config, and a 3.5 MB static binary I can hand to anyone.
The one thing I missed is sum types. The taxonomy is a table of structs with string fields, where an enum would have the compiler check exhaustiveness for me. So I wrote a property test instead: every reason’s final rule is unconditional, so classification can never fall through.
That is the Go answer and it is a good one. It spends a test where another language spends a keyword.
Which is the thread I pulled a week later, when I wrote the whole thing again in Rust.